Table of Contents
• Introduction to Zabbix: Understanding the Essentials
• Setting Up Zabbix: Installation and Configuration
• Monitoring Network Infrastructure with Zabbix
• Advanced Monitoring Techniques with Zabbix
• Analyzing and Reporting Network Data in Zabbix
• Conclusion
Introduction to Zabbix: Understanding the Essentials
Welcome to our comprehensive guide on Zabbix, a powerful network monitoring solution that helps organisations gain insights into their network infrastructure. In today's interconnected world, maintaining a stable and secure network is crucial for businesses to thrive. Zabbix offers a robust set of features and capabilities to monitor network devices, servers, and applications, ensuring optimal performance and minimizing downtime.
Zabbix is an open-source monitoring tool that provides a flexible and scalable platform for monitoring and managing diverse IT environments. With its extensive range of monitoring options and intuitive interface, Zabbix has gained popularity among system administrators and network engineers worldwide.
The Significance of Zabbix in Network Monitoring
As networks grow in complexity and scale, it becomes increasingly challenging to keep track of various components and ensure their smooth operation. This is where Zabbix comes in. It allows organisations to monitor and collect data from a wide range of devices, including routers, switches, servers, virtual machines, and more. By aggregating this data in one centralised location, Zabbix provides a holistic view of the network's performance and health.
Zabbix offers real-time monitoring, alerting, and reporting capabilities, enabling administrators to detect and respond to issues promptly. Its robust notification system can send alerts via email, SMS, or even integrate with popular collaboration platforms like Slack, ensuring that critical incidents are addressed in a timely manner.
Zabbix Versus Other Network Monitoring Solutions
When it comes to choosing a network monitoring solution, there are several options available in the market. Zabbix stands out for its open-source nature, providing a cost-effective solution without compromising functionality. The active Zabbix community contributes to its continuous development and offers a wealth of resources and support.
Compared to proprietary solutions, Zabbix offers flexibility and customisation options tailored to specific monitoring requirements. Its modular architecture allows users to extend and adapt Zabbix to suit their unique network infrastructure and monitoring needs.
Additionally, Zabbix's extensive documentation and user-friendly interface make it accessible to both beginners and experienced users. The availability of numerous plugins and integrations further enhances its versatility, enabling seamless integration with existing IT tools and systems.
With its comprehensive set of features, flexibility, and active community support, Zabbix has established itself as a leading network monitoring solution for organisations of all sizes and industries.
Setting Up Zabbix: Installation and Configuration
In this section, we will guide you through the process of installing and configuring Zabbix 6.4, the latest version of this powerful network monitoring tool. By following these steps, you'll have a functional Zabbix installation ready to monitor your network infrastructure.
Step 1: System Requirements
Before installing Zabbix, ensure that your system meets the minimum requirements. These include:
• Operating System: Zabbix supports a wide range of operating systems, including Linux, Windows, and macOS. Check the official documentation for the specific requirements for your chosen operating system.
• Database Server: Zabbix requires a relational database management system (RDBMS) such as MySQL, PostgreSQL, or Oracle. Make sure you have a compatible RDBMS installed and running.
• Web Server: Zabbix utilizes a web interface for configuration and monitoring. You'll need a web server like Apache or Nginx, along with PHP support.
Step 2: Download and Install Zabbix
Start by downloading the Zabbix 6.4 package from the official Zabbix website. Choose the appropriate package for your operating system and select the OS distribution and follow the instructions.
Step 3: Configuring Zabbix
Once the installation is complete, it's time to configure Zabbix. The configuration process involves:
• Database Configuration: Configure the connection settings to your chosen RDBMS, including the database name, username, and password. Refer to the Zabbix documentation for specific instructions on configuring the database.
• Web Interface Setup: Set up the web server configuration to serve the Zabbix web interface. Ensure that PHP is properly configured, and follow the provided instructions to enable the Zabbix web interface.
• Initial Setup: Access the Zabbix web interface using a web browser. You'll be prompted to perform the initial setup, including creating an administrator account and configuring basic settings.
For detailed guidance on configuring Zabbix, refer to the official Zabbix installation documentation specific to your operating system.
Congratulations! You have now successfully installed and configured Zabbix 6.4. You can begin adding hosts, configuring monitoring parameters, and exploring the rich set of features offered by Zabbix.
Monitoring Network Infrastructure with Zabbix
In this section, we will explore how to effectively monitor your network infrastructure using Zabbix 6.4. By implementing network monitoring with Zabbix, you can gain valuable insights into the performance, availability, and health of your network devices, ensuring optimal operation and proactive issue resolution.
1. Define Network Monitoring Requirements and Objectives
Before setting up network monitoring in Zabbix, it is crucial to define your monitoring requirements and objectives. Consider the following aspects:
• Determine the network devices and components that need to be monitored, such as routers, switches, firewalls, and load balancers.
• Identify the key performance metrics to monitor, such as bandwidth utilisation, latency, packet loss, and device health indicators.
• Establish the monitoring frequency and thresholds for triggering alerts and notifications.
By clearly defining your monitoring requirements and objectives, you can tailor Zabbix to collect the relevant data and provide meaningful insights into your network infrastructure.
2. Setting Up Zabbix to Monitor Network Devices
Zabbix offers a range of methods to monitor network devices. Here are some key steps to follow:
• Add network devices to Zabbix: Configure Zabbix to discover and monitor network devices by adding them as hosts in the Zabbix web interface. Provide the necessary parameters, such as IP address, SNMP credentials, and monitoring templates.
• Utilize SNMP monitoring: Zabbix supports Simple Network Management Protocol (SNMP), enabling you to monitor a wide variety of network device metrics. Configure SNMP checks to collect data on CPU usage, interface statistics, memory utilization, and more.
• Implement ICMP monitoring: Zabbix can also perform ICMP (Internet Control Message Protocol) checks to monitor network availability and latency. Set up ICMP pings to monitor the reachability and response times of your network devices.
• Configure custom monitoring: For specialized network devices or protocols, you can create custom monitoring scripts or use Zabbix's flexible scripting capabilities to collect specific metrics or perform custom checks.
By leveraging these monitoring methods, you can gather comprehensive data on your network infrastructure and ensure proactive management.
3. Collecting and Analysing Network Traffic Data with Zabbix
Zabbix provides powerful capabilities to monitor and analyse network traffic. Here's how:
• Enable network traffic monitoring: Configure Zabbix to collect network traffic data using technologies such as NetFlow, sFlow, or IPFIX. This allows you to monitor bandwidth usage, analyse traffic patterns, and detect anomalies
• Visualise network traffic data: Utilize Zabbix's built-in dashboards and visualization features to create graphs, charts, and reports that provide insights into network traffic trends, top talkers, and traffic distribution.
• Set up threshold-based alerts: Define threshold values for network traffic metrics and configure Zabbix to trigger alerts and notifications when traffic exceeds these thresholds. This helps you identify network congestion or potential performance issues.
By monitoring network traffic with Zabbix, you can identify bottlenecks, plan capacity upgrades, and optimize network performance.
Advanced Monitoring Techniques with Zabbix
In this section, we will explore advanced monitoring techniques with Zabbix 6.4 that go beyond basic network monitoring. These techniques allow you to leverage the full power of Zabbix and customize your monitoring solution to meet specific needs, enhance proactive management, and gain deeper insights into your IT infrastructure.
1. Creating Custom Monitoring Templates and Triggers
Zabbix offers the flexibility to create custom monitoring templates and triggers tailored to your specific environment. Here's how:
• Template creation: Design custom monitoring templates to define the metrics and checks relevant to your applications, servers, or devices. Templates allow you to reuse configurations across multiple hosts, ensuring consistency and simplifying management.
• Trigger customisation: Create triggers to define conditions that indicate a problem or an abnormal situation. Customise trigger expressions to match your specific monitoring requirements, such as specific performance thresholds, event correlations, or log file monitoring.
By creating custom monitoring templates and triggers, you can monitor unique aspects of your IT infrastructure and receive alerts when specific conditions are met.
2. Monitoring Network Services and Protocols
Zabbix provides capabilities to monitor various network services and protocols to ensure their availability and performance. Consider the following:
• Service monitoring: Utilise Zabbix's agent-based or agentless monitoring to check the availability and responsiveness of network services, such as DNS, HTTP, FTP, SMTP, and more. Set up custom checks or utilise Zabbix's preconfigured service monitoring templates.
• Protocol monitoring: Implement protocol-specific monitoring to ensure the proper functioning of critical protocols like SNMP, ICMP, SIP, or custom protocols. Monitor protocol response times, packet loss, or specific protocol attributes to detect potential issues.
By monitoring network services and protocols with Zabbix, you can proactively identify service disruptions and troubleshoot network communication problems.
3. Leveraging Zabbix for Proactive Network Management and Troubleshooting
Zabbix offers features that enable proactive network management and troubleshooting. Consider the following techniques:
• Intelligent event correlation: Configure Zabbix to correlate events and trigger actions based on specific event patterns or combinations. This helps reduce alert noise and enables you to focus on critical issues.
• Log file monitoring: Utilise Zabbix's log file monitoring capabilities to analyse log entries and trigger alerts based on specific log patterns. This helps identify potential issues or security breaches.
• Problem trend analysis: Utilise Zabbix's trend analysis and historical data to identify recurring issues, predict potential problems, and plan preventive actions. Leverage Zabbix's reporting capabilities to generate insights on network performance and identify areas for improvement.
By leveraging these advanced techniques, you can proactively manage your network, identify and resolve issues before they impact your IT infrastructure, and optimise the performance of your systems.
To explore further advanced monitoring techniques and customisation options in Zabbix 6.4, refer to the official Zabbix documentation and join the active Zabbix community for additional support and resources.
Analyzing and Reporting Network Data in Zabbix
In this section, we will explore how to analyse and report on network data collected by Zabbix 6.4. By leveraging Zabbix's powerful analysis and reporting capabilities, you can gain valuable insights into your network performance, troubleshoot issues, and present meaningful reports to stakeholders.
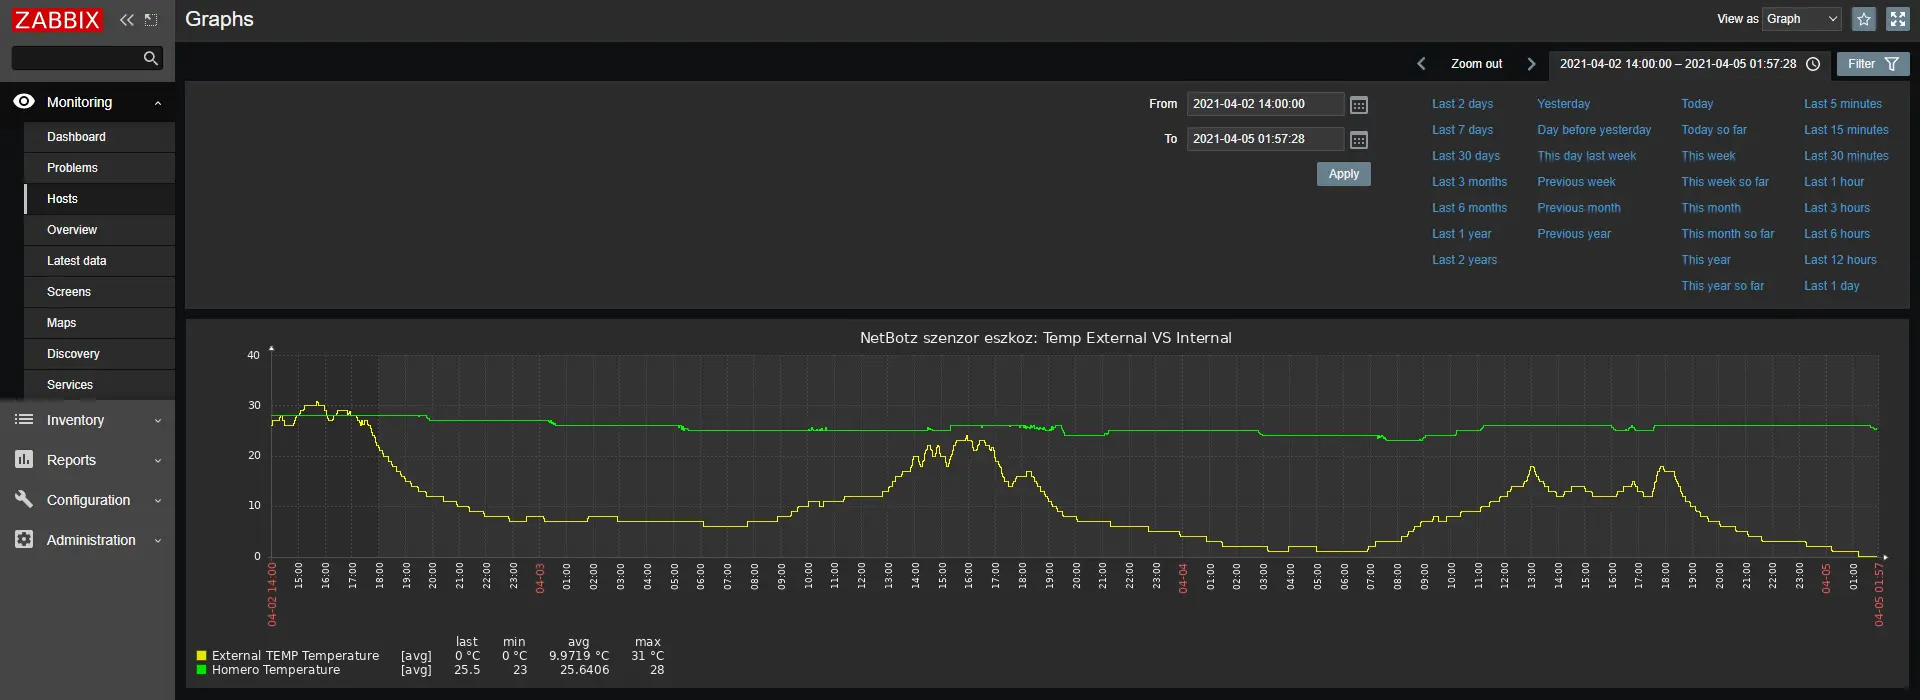
1. Utilizing Zabbix Monitoring Dashboards
Zabbix provides customisable dashboards that allow you to visualise and analyse network data. Here's how to leverage them:
• Create custom dashboards: Utilise Zabbix's dashboard functionality to design personalised views of your network performance data. Arrange widgets, charts, and graphs to display the key metrics and trends you want to monitor.
• Drill-down capabilities: Take advantage of Zabbix's drill-down functionality to explore data in more detail. By interacting with charts and graphs, you can zoom in on specific timeframes, hosts, or metrics for deeper analysis.
By utilising Zabbix monitoring dashboards, you can have a consolidated view of your network performance metrics and identify patterns or anomalies.
2. Analysing Network Data with Zabbix
Zabbix offers powerful analysis features that allow you to derive insights from collected network data. Consider the following techniques:
• Trend analysis: Utilise Zabbix's trend analysis capabilities to identify long-term performance trends and forecast future behaviour. Analyse historical data to detect patterns, plan capacity upgrades, and optimise resource allocation.
• Event correlation: Leverage Zabbix's event correlation capabilities to identify the relationships between events and uncover root causes. Analyse correlated events to determine the impact of specific incidents on your network infrastructure.
• Data exploration: Utilize Zabbix's data exploration tools to dig deeper into your network data. Apply filters, perform ad-hoc queries, and generate custom reports to extract specific information and perform detailed analysis.
By effectively analysing network data with Zabbix, you can identify performance bottlenecks, troubleshoot issues, and make informed decisions to optimise your network infrastructure.
3. Generating Reports in Zabbix
Zabbix enables you to generate comprehensive reports to share network performance insights with stakeholders. Here's how to create reports:
• Report templates: Utilise Zabbix's report templates or create custom report templates to define the structure and content of your reports. Include relevant network metrics, charts, and tables to present the desired information.
• Scheduled reports: Set up scheduled reports to automate the generation and delivery of reports to stakeholders. Define the frequency, recipients, and report format (e.g., PDF, CSV) to ensure regular distribution of network performance insights.
By generating reports in Zabbix, you can effectively communicate network performance metrics, trends, and key findings to stakeholders and support decision-making processes.
To learn more about analyzing and reporting network data in Zabbix 6.4, consult the official Zabbix documentation and explore their analysis and reporting guides for detailed instructions and examples.
Conclusion
Zabbix 6.4 is a powerful network monitoring solution that provides comprehensive insights into your IT infrastructure's performance, availability, and health. By following the guidelines and techniques outlined in this guide, you can harness the full potential of Zabbix to effectively monitor your network, troubleshoot issues, and optimise your infrastructure.
We started by understanding the essentials of Zabbix, including its architecture, key features, and benefits. We then explored the installation and configuration process, ensuring that Zabbix 6.4 was set up correctly on your chosen operating system. With Zabbix in place, we delved into monitoring network infrastructure, covering the monitoring of devices, services, protocols, and network traffic.
To further enhance your monitoring capabilities, we discussed advanced techniques such as creating custom monitoring templates, leveraging proactive management features, and utilizing Zabbix's flexibility for customisation. These advanced techniques empower you to tailor Zabbix to your specific needs, ensuring optimal monitoring of your network and IT assets.
We also explored the analysis and reporting capabilities of Zabbix, emphasizing the importance of visualizing network data through monitoring dashboards, performing trend analysis, event correlation, and generating informative reports. These features enable you to gain valuable insights, identify performance issues, and communicate network performance metrics effectively to stakeholders.
As you embark on your network monitoring journey with Zabbix, remember to refer to the official Zabbix documentation for detailed instructions, tips, and troubleshooting guides. Additionally, the vibrant Zabbix community is a valuable resource for support and sharing best practices with fellow Zabbix users.
With Zabbix as your network monitoring tool, you have the power to proactively manage your network, ensure optimal performance, and maintain a robust IT infrastructure. By leveraging the features and techniques discussed in this guide, you are well-equipped to harness the full potential of Zabbix and achieve network monitoring excellence.
Start your Zabbix journey today and experience the benefits of comprehensive network monitoring, proactive management, and informed decision-making.